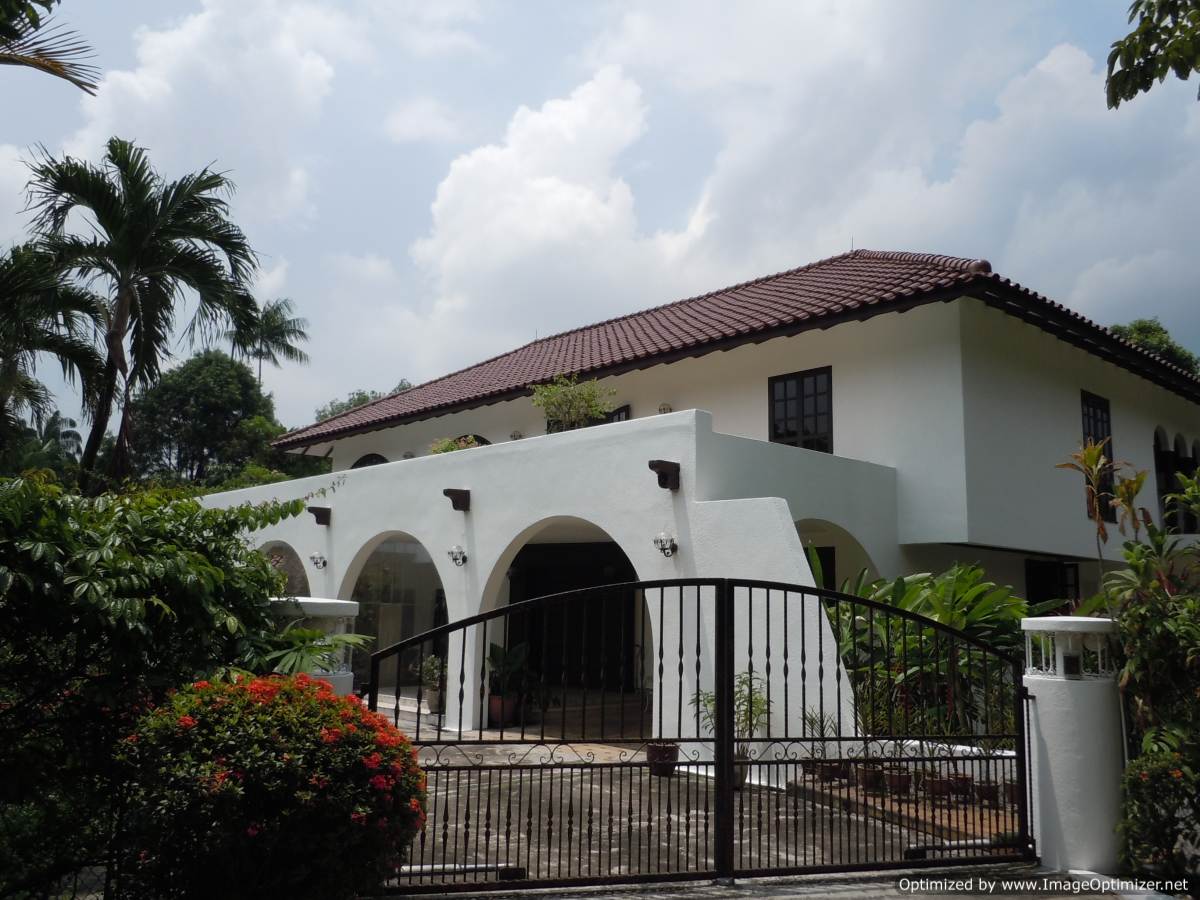
According to two industry veterans prices of landed homes in land-scarce Singapore are better positioned to withstand market changes compared to their non-landed private counterparts.
SLP International research head Nicholas Mak and GPS Alliance chief executive Jeffrey Hong noted that for this category of houses price declines are milder and price hikes more pronounced. This trend is attributed to a combination of limited supply and an influx of wealthy immigrants.
Constantly challenged by the limited land in the country, the Singapore Government has assigned restrictions to the purchase of landed homes by foreigners and PRs. The former are limited only to landed housing in Sentosa Cove; whereas the latter are allowed to purchase – up to a maximum area of 1,393.5 sq m – on the mainland island as well, with the exception of the Good Class Bungalows (GCB) area. Additionally there exists certain restrictions including a minimum occupancy period, owner occupancy, and restriction to only one landed residence at any one time.
Examining the URA price indices from Q2 2009, during the early days of the property bull run, to the first quarter of this year when the run has begun to lose steam, we note that true enough the surge in prices for landed homes is markedly higher than for non-landed ones during the initial property boom between 2009 to 2011, and gradually moderated – most probably due to the successive rounds of anti-speculative measures implemented by the Singapore Government.
As seen in Table 1, the quarter-on-quarter (Q-o-Q) spikes in the index for landed homes were more than double than that for non-landed homes for most quarters between 4Q2009 and 3Q2011.
On the other hand, the price decline for landed residences versus non-landed residences is more gradual only for Q12014 when the Q-o-Q change is 0.66 per cent as opposed to 1.30 per cent.
For the preceding quarter, the Q-o-Q dip for landed homes was 1.02 per cent outstripping that for non-landed homes (0.86 per cent) and overall residences (0.92 per cent).
Thus it remains to be seen if the scarcity factor of landed housing will ensure a softer landing for this category of property during a bearish market.
Table 1: Price Indices For Landed vs Non-landed Private Homes
|
Period |
All |
Q-o-Q % Change |
Landed |
Q-o-Q % Change |
Non-Landed |
Q-o-Q % Change |
|
1Q2014 |
211.6 |
(1.26) |
241.50 |
(0.66) |
204.7 |
(1.30) |
|
4Q2013 |
214.3 |
(0.92) |
243.10 |
(1.02) |
207.4 |
(0.86) |
|
3Q2013 |
216.3 |
0.42 |
245.60 |
0.29 |
209.2 |
0.58 |
|
2Q2013 |
215.4 |
1.03 |
244.90 |
0.33 |
208 |
1.46 |
|
1Q2013 |
213.2 |
0.57 |
244.10 |
0.45 |
205 |
0.74 |
|
4Q2012 |
212 |
1.83 |
243.00 |
1.80 |
203.5 |
1.75 |
|
3Q2012 |
208.2 |
0.63 |
238.70 |
1.14 |
200 |
0.50 |
|
2Q2012 |
206.9 |
0.44 |
236.00 |
0.43 |
199 |
0.45 |
|
1Q2012 |
206 |
(0.10) |
235.00 |
0.09 |
198.1 |
(0.15) |
|
4Q2011 |
206.2 |
0.24 |
234.80 |
0.13 |
198.4 |
0.30 |
|
3Q2011 |
205.7 |
1.33 |
234.50 |
2.36 |
197.8 |
1.12 |
|
2Q2011 |
203 |
1.96 |
229.10 |
3.57 |
195.6 |
1.40 |
|
1Q2011 |
199.1 |
2.21 |
221.20 |
3.90 |
192.9 |
1.69 |
|
4Q2010 |
194.8 |
2.74 |
212.90 |
5.50 |
189.7 |
1.83 |
|
3Q2010 |
189.6 |
2.93 |
201.80 |
7.74 |
186.3 |
1.58 |
|
2Q2010 |
184.2 |
5.26 |
187.30 |
6.24 |
183.4 |
5.04 |
|
1Q2010 |
175 |
5.61 |
176.30 |
8.29 |
174.6 |
4.93 |
|
4Q2009 |
165.7 |
7.39 |
162.80 |
8.32 |
166.4 |
7.22 |
|
3Q2009 |
154.3 |
15.75 |
150.30 |
14.91 |
155.2 |
15.91 |
|
2Q2009 |
133.3 |
(4.72) |
130.80 |
(4.73) |
133.9 |
(4.70) |
Source: URA
More specifically. we look at the trends of the URA price indices by the types of landed homes.
Table 2: Price Indices For Landed Homes By Types
|
Period |
Landed: Detached |
Q-o-Q % Change |
Landed: Semi Detached |
Q-o-Q % Change |
Landed: Terrace |
Q-o-Q % Change |
|
1Q2014 |
244.2 |
(2.44) |
224 |
(0.04) |
250.2 |
0.44 |
|
4Q2013 |
250.3 |
(0.87) |
224.1 |
(2.35) |
249.1 |
(0.40) |
|
3Q2013 |
252.5 |
(1.33) |
229.5 |
1.06 |
250.1 |
1.50 |
|
2Q2013 |
255.9 |
(0.31) |
227.1 |
(0.48) |
246.4 |
1.52 |
|
1Q2013 |
256.7 |
0.35 |
228.2 |
0.13 |
242.7 |
0.87 |
|
4Q2012 |
255.8 |
1.91 |
227.9 |
2.84 |
240.6 |
1.18 |
|
3Q2012 |
251 |
1.99 |
221.6 |
0.64 |
237.8 |
0.76 |
|
2Q2012 |
246.1 |
(0.40) |
220.2 |
0.59 |
236 |
1.24 |
|
1Q2012 |
247.1 |
(1.24) |
218.9 |
0.18 |
233.1 |
1.75 |
|
4Q2011 |
250.2 |
0.40 |
218.5 |
(0.59) |
229.1 |
0.22 |
|
3Q2011 |
249.2 |
0.65 |
219.8 |
3.73 |
228.6 |
3.91 |
|
2Q2011 |
247.6 |
3.25 |
211.9 |
3.87 |
220 |
3.77 |
|
1Q2011 |
239.8 |
4.08 |
204 |
2.82 |
212 |
3.92 |
|
4Q2010 |
230.4 |
8.47 |
198.4 |
3.06 |
204 |
3.71 |
|
3Q2010 |
212.4 |
8.37 |
192.5 |
7.54 |
196.7 |
7.19 |
|
2Q2010 |
196 |
6.81 |
179 |
5.98 |
183.5 |
5.58 |
|
1Q2010 |
183.5 |
9.55 |
168.9 |
7.51 |
173.8 |
7.42 |
|
4Q2009 |
167.5 |
7.93 |
157.1 |
7.60 |
161.8 |
9.40 |
|
3Q2009 |
155.2 |
15.65 |
146 |
13.44 |
147.9 |
15.10 |
|
2Q2009 |
134.2 |
(5.96) |
128.7 |
(3.60) |
128.5 |
(3.89) |
Source: URA
The more affordable overall price quantum for smaller homes (terraces) cushion it from sharp price dips in a slowing market. Since Q2 2009, the index for terraces fell into the red only in two quarters, fewer than half of the quarters for detached and semi-detached homes.
In fact even in the latest quarter, prices for terraces rose after falling in Q1 2014, bucking the trend seen for the other two landed house types.
However, there was no noticeable difference in price increases for the various landed home types during the initial property boom in 2009.
Separately, for the two different types of non-landed homes: apartments and condominiums, we also study the URA price indices trends.
Apart from other differences in building criteria, one of the key differences between apartments and condominiums is the site area. The former has no minimum site area or mandatory communal spaces.
Despite the usually more cramped site area of apartments, the Q-o-Q price increase is generally greater for apartments compared to condominiums, at least going by the URA price indices as seen in Table 3.
Perhaps the relatively lower prices of these homes led to brisk demand, pushing up prices.
Table 3: Price Indices For Non-Landed Homes By Types
|
Period |
Non-Landed: Apartment |
Q-o-Q % Change |
Non Landed: Condominium |
Q-o-Q % Change |
|
1Q2014 |
220.1 |
(0.95) |
197.7 |
(1.64) |
|
4Q2013 |
222.2 |
(1.51) |
201 |
(0.45) |
|
3Q2013 |
225.6 |
(0.27) |
201.9 |
1.00 |
|
2Q2013 |
226.2 |
1.57 |
199.9 |
1.42 |
|
1Q2013 |
222.7 |
0.95 |
197.1 |
0.56 |
|
4Q2012 |
220.6 |
2.46 |
196 |
1.24 |
|
3Q2012 |
215.3 |
1.13 |
193.6 |
0.21 |
|
2Q2012 |
212.9 |
0.95 |
193.2 |
0.16 |
|
1Q2012 |
210.9 |
0.67 |
192.9 |
(0.62) |
|
4Q2011 |
209.5 |
0.24 |
194.1 |
0.41 |
|
3Q2011 |
209 |
1.06 |
193.3 |
1.15 |
|
2Q2011 |
206.8 |
1.82 |
191.1 |
1.22 |
|
1Q2011 |
203.1 |
0.84 |
188.8 |
2.05 |
|
4Q2010 |
201.4 |
2.39 |
185 |
1.59 |
|
3Q2010 |
196.7 |
3.09 |
182.1 |
1.05 |
|
2Q2010 |
190.8 |
5.18 |
180.2 |
5.01 |
|
1Q2010 |
181.4 |
3.60 |
171.6 |
5.67 |
|
4Q2009 |
175.1 |
9.71 |
162.4 |
6.07 |
|
3Q2009 |
159.6 |
16.16 |
153.1 |
15.81 |
|
2Q2009 |
137.4 |
(4.91) |
132.2 |
(4.48) |
Source: URA
Property boom or bust, you will never go wrong with the FREE service of an iCompareLoan mortgage expert who will help you compare mortgage loan Singapore!
For advice on a new home loan.
For refinancing advice.
Download this article here.


