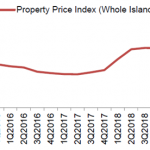
Office market decreased by 0.5% in 4th Quarter 2019, compared with the 3.9% decrease in the previous quarter said URA in its release of its latest statistics.
Prices and Rental in the Office Market
Table of Contents
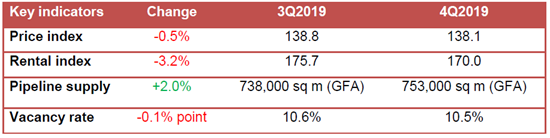
Rentals of office space decreased by 3.2% in 4th Quarter 2019, compared with the 0.6% decrease in the previous quarter. For the whole of 2019, prices of office space decreased by 0.6%, compared with the increase of 5.7% in 2018; while rentals of office space decreased by 3.1%, compared with the increase of 7.4% in 2018.
Supply in the Pipeline in the Office Market
As at the end of 4th Quarter 2019, there was a total supply of about 753,000 sq m GFA of office space in the pipeline, compared with the 738,000 sq m GFA of office space in the pipeline in the previous quarter.
Stock and Vacancy in the Office Market
The amount of occupied office space increased by 30,000 sq m (nett) in 4th Quarter 2019, compared with the increase of 71,000 sq m (nett) in the previous quarter. The stock of office space increased by 29,000 sq m (nett) in 4th Quarter 2019, compared with the decrease of 4,000 sq m (nett) in the previous quarter. As a result, the island-wide vacancy rate of office space declined to 10.5% as at the end of 4th Quarter 2019, from 10.6% as at the end of the previous quarter.
As prices in the office market decreased, prices of retail space increased by 1.8% in 4th Quarter 2019, compared with the increase of 1.1% in the previous quarter.
Rentals of retail space increased by 2.3% in 4th Quarter 2019, following the same increase of 2.3% in the previous quarter. For the whole of 2019, prices of retail space increased by 1.3%, compared with the increase of 0.6% in 2018; while rentals of retail space increased by 2.9%, compared with the decline of 1.0% in 2018.
Supply in the Pipeline
As at the end of 4th Quarter 2019, there was a total supply of 333,000 sq m GFA of retail space from projects in the pipeline, compared with the 288,000 sq m GFA of retail space in the pipeline in the previous quarter.
Stock and Vacancy
The amount of occupied retail space increased by 26,000 sq m (nett) in 4th Quarter 2019, compared with the increase of 29,000 sq m (nett) in the previous quarter. The stock of retail space increased by 29,000 sq m (nett) in 4th Quarter 2019, compared with the increase of 16,000 sq m (nett) in the previous quarter. As the changes in occupied retail space and stock of retail space were similar, the island-wide vacancy rate of retail space remained at 7.5% as at the end of 4th Quarter 2019, same as the end of the previous quarter.
Prices and Rentals of private homes according to 4th Quarter 2019 real estate statistics
Prices of private residential properties increased by 0.5% in 4th Quarter 2019, compared with the 1.3% increase in the previous quarter. For the whole of 2019, prices of private residential properties increased by 2.7%, compared with the 7.9% increase in 2018.
Prices of landed properties increased by 3.6% in 4th Quarter 2019, compared with 1.0% increase in the previous quarter. Prices of non-landed properties decreased by 0.3% in 4th Quarter 2019, compared with the 1.3% increase in the previous quarter. For the whole of 2019, prices of landed properties rose by 5.7% while those of non-landed properties rose by 1.9%.
Prices of non-landed properties in Core Central Region (CCR) decreased by 2.8% in 4th Quarter 2019, compared with the 2.0% increase in the previous quarter. Prices of non-landed properties in Rest of Central Region (RCR) decreased by 1.3%, compared with the 1.3% increase in the previous quarter. Prices of non-landed properties in Outside Central Region (OCR) increased by 2.8%, compared with the 0.8% increase in the previous quarter. For the whole of 2019, prices of non-landed properties in CCR decreased by 1.7%, while prices in RCR and OCR increased by 2.8% and 4.2% respectively.
Rentals of private residential properties decreased by 1.0% in 4th Quarter 2019, compared with the 0.1% increase in the previous quarter. For the whole of 2019, rentals of private residential properties increased by 1.4% compared with the 0.6% increase in 2018.
Rentals of landed properties decreased by 1.6% in 4th Quarter 2019, compared with the 2.3% decrease in the previous quarter. Rentals of non-landed properties decreased by 0.9%, compared with the 0.4% increase in the previous quarter. For the whole of 2019, rentals of landed properties decreased by 3.4% while rentals of non-landed properties increased by 1.9%.
Rentals of non-landed properties in CCR decreased by 1.0%, compared with the 0.7% decrease in the previous quarter. Rentals in RCR decreased by 0.7%, compared with the 1.6% increase in the previous quarter. Rentals in OCR decreased by 1.0%, compared with the 0.8% increase in the previous quarter. For the whole of 2019, rentals of non-landed properties increased by 1.4%, 2.0% and 2.7% in CCR, RCR and OCR respectively.
As at the end of 4th Quarter 2019, there was a total supply of 49,173 uncompleted private residential units (excluding ECs) in the pipeline with planning approvals, compared with the 50,964 units in the previous quarter. Of this number, 30,162 units remained unsold as at the end of 4th Quarter 2019, compared with the 31,948 units in the previous quarter.
The stock of completed private residential units (excluding ECs) increased by 1,476 units in 4th Quarter 2019, compared with the increase of 278 units in the previous quarter. The stock of occupied private residential units (excluding ECs) increased by 3,816 units in 4th Quarter 2019, compared with the increase of 1,095 units in the previous quarter. As a result, the vacancy rate of completed private residential units (excluding ECs) decreased to 5.5% as at the end of 4th Quarter 2019, from 6.1% in the previous quarter.
Vacancy rates of completed private residential properties as at the end of 4th Quarter 2019 in CCR, RCR and OCR were 6.9%, 5.8% and 4.7% respectively, compared with the 8.2%, 6.0% and 5.3% in the previous quarter.