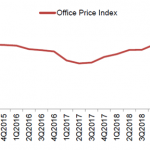
Private home prices rose at slower pace in Q4 2019, rising by 0.5% compared to the 1.3% increase in the previous quarter. This was slightly higher than the initial forecast of a 0.3% growth in the flash estimates which were released earlier this month.
Looking at the statistics for the three regions, we could perhaps infer that the difference between the actual figures and flash estimates may be due to better prices achieved in the Core Central Region in both the primary and resale markets in the last two to three weeks of the year. (CCR prices fell at a slower pace of 2.8% in the actual data vs. 3.7% decline in the flash estimates, which tracked transactions in the first 10 weeks of the quarter.)
With Q4’s numbers out, the private residential price index is now 2.6% above the most recent peak in Q3 2018 – marginally above the level prior to the cooling measures (introduced in July 2018) – and 0.6% below the all-time peak in Q3 2013.
For the whole of 2019, private home prices rose 2.7%, representing the third straight year of increase. However, the pace of price growth has eased substantially from the 7.9% increase in 2018.
Table of Contents
Noting that private home prices rose at slower pace in Q4 2019, Colliers International said, “to this end, we believe the government has successfully brought the housing market to a soft landing via the July 2018 measures. Based on our observation, there is no over exuberance in the market and buyers remain very price sensitive, which will rein in developers’ ability to hike prices sharply.”
Even as the private home prices rose at slower pace in Q4 2019, developers sold 9,912 private residential units, 12.7% more than the 8,795 units in the previous year
“Take-up
Developers sold 2,443 new homes (excluding Exec Condos) in Q4 2019 – down by 25.5% quarter-on-quarter (QOQ) (3,281 in Q3 2019) and up 33.1% year-on-year (YOY) (1,836 in Q4 2018).
For the whole of 2019, developers sold 9,912 private residential units, 12.7% more than the 8,795 units in the previous year, reflecting the acceptance of the cooling measures in July 2018 and the resilient genuine demand.
Meanwhile, secondary (resale and subsale) transactions stood at 2,435 units in Q4, a 1.9% decline from the 2,482 units in Q3 2019 but 20.3% higher YOY (from 2,024 in Q4 2018). For full year 2019, there were 9,238 secondary transactions, 30.8% lower than 2018’s 13,344 units.
The July 2018 measures appeared to have impacted the secondary market more than primary sales, as the increased availability of new attractive projects from developers diverted demand from the secondary market.
Core Central Region (CCR)
According to URA’s data, prices in the CCR declined 2.8% (vs 3.7% in flash) from the previous quarter, after rising 2.0% QOQ in Q3 2019 and 2.3% in Q2 2019. This brought CCR home prices to fall 1.7% in the full year, after rising 6.7% in 2018. CCR home prices are 2.7% below the recent peak in Q3 2018 and 5.0% below the all-time peak in Q1 2013.
Q4 2019 saw the most developer/new sales in the CCR since 2014. As of caveats downloaded on 22 January 2020, in Q4 2019, 397 new sales in CCR were clocked, the highest quarterly figure since Q4 2014’s 441.
For 2019, we estimate 18 projects with a total 3,045 available units were launched in the CCR and the take-up rate (of the total available units) was 20%. The slower take-up rate could be due to the larger ticket size of the units, notwithstanding most are also launched at benchmark prices in their vicinities.
A closer look at the transactions during the quarter suggests that the decrease in Q4 non-landed CCR prices could be due to projects that have been completed earlier but still have inventory:
• Marina One Residences (completed in 2017) saw 49 units sold in Q4 2019, at a median price of SGD2,242 psf compared to 30 units in Q3 2019 at a median price of SGD2,503 psf.
• South Beach Residences (completed in 2016) saw 10 units sold in Q4 2019, at a median price of SGD3,166 psf compared to 10 units in Q3 2019 at a median price of SGD3,349 psf.
Rest of Central Region (RCR)
Home values in RCR declined 1.3% QOQ (vs 1.4% in flash) in Q4, after rising 1.3% in Q3. This brought RCR home prices to still increase by 2.8% in 2019, a slowdown from the 7.4% growth in 2018. RCR home prices are now 1.4% below the peak of 155.6 seen in Q2 2013.
We believe the decline is due to the high base achieved in new launches in Q3 2019 for new launches such as Avenue South Residence, One Pearl Bank, Meyer Mansion, The Antares, Uptown@Farrer, and View at Kismis.
We estimate 19 projects with a total 5,131 available units were launched in RCR in 2019 and the take-up rate by end-2019 was 29%.
Outside Central Region (OCR)
In Q4 2019 and 2019, OCR private home prices rose the most among the market segments and remained at an all-time high. Non-landed home values in OCR increased 2.8% QOQ (vs 2.9% in flash) in Q4, following the 0.8% increase in Q3 2019. This brings full year 2019 growth to 4.2%, a slowdown from the 9.4% in 2018.
We believe the growth in OCR prices in Q4 was mainly due to the good reception of Sengkang Grand Residences, as well as steady progressive take-up at earlier launches. Meanwhile, some earlier launches such as Treasure at Tampines and Florence Residences continued their progressive take-up.
We estimate 13 new projects with a total of 7,782 available units were launched in the OCR in 2019, and the take-up was a decent 32% by end-2019.
Supply pipeline, vacancy, unsold inventory
In Q4 2019, 2,298 private homes obtained Temporary Occupation Permit (TOP), bringing full year completions to 7,527 units, 17.4% lower than 9,112 units completed in 2018. We expect 2020 completions to come in at just 6,294 units. 2019-2020 completions will be significantly below the 10-year historical average of 12,948 units.
In 2021, completions will likely rise to 10,579 private homes, and further to 15,037 units in 2022, and 17,004 units in 2023, due to the bumper en bloc transactions from 2016 to mid-2018.
For the non-landed segment, as demand outstrips available completed supply, the vacancy rate declined a further 0.7 ppt to 5.7% in Q3, from 6.4% in Q3. The peak vacancy was 10.4% in Q2 2016.
Unsold inventory eased to 30,162 units by end-2019, compared to 31,948 units in Q3 2019. Assuming the take-up of 10,000 units a year, it will take three years to clear.
Rentals
The overall private residential rental index unexpectedly declined 1.0% in Q4 2019 after rising 0.1% QOQ in Q3. This brings full year 2019 rental increase to 1.4%, faster than the 0.6% increase in 2018. Overall rents are still 11.6% below the peak in Q3 2013.
We expect rents to continue to improve by 5% in 2020, as completions will be significantly below the 10-year historical annual average of 12,948 units and vacancy continues to tighten below the historical average of 8%.”
Ms Tricia Song, Head of Research for Singapore at Colliers International noting that private home prices rose at slower pace in Q4 2019 said:
“To ensure the property market remains healthy, we believe the government will keep the existing property curbs in place, with little chance of unwinding any measures, barring a severe economic downturn.
We are of the view that the property market is sustainable and home sales should be fairly resilient in 2020, owing to several factors: improved economic outlook (Oxford Economics projects that the Singapore economy could grow by 1.4% in 2020); stabilising global growth; favourable interest rate environment; genuine demand for homes; tight labour market; and relatively healthy household balance sheet.
For the whole of 2020, we project that developers could sell about 9,800 new homes (excl. ECs), relatively similar to the number of units transacted in 2019. Meanwhile, we expect private home prices could grow by 3% in 2020, tracking the recovery in economic growth.
We estimate that there would be 44 new private residential project launches (excl. ECs) in 2020, fewer than the 50 (excl. ECs) launched in 2019. Of the 44 launches this year, about 45% of them are in prime locations in the Core Central Region (CCR). With fewer launches in 2020, we would expect buyers to dip into earlier launches for more diverse choices and homes that would fit their budget.”