The Urban Redevelopment Authority (URA) on Jan 25 released the real estate statistics for 4th Quarter 2018, which showed that the prices of private residential properties declined.
PRIVATE RESIDENTIAL PROPERTIES
Private residential market at a glance:

* Figures exclude Executive Condominium (ECs)
Prices and Rentals
Prices of private residential properties decreased by 0.1% in 4th Quarter 2018, compared with the 0.5% increase in the previous quarter.
Table of Contents
For the whole of 2018, prices of private residential properties increased by 7.9%, compared with the 1.1% increase in 2017.
Property Price Index of private residential properties

Prices of landed properties declined by 2.0% in 4th Quarter 2018, compared with the 2.3% increase in the previous quarter. Prices of non-landed properties increased by 0.5% in 4th Quarter 2018, after remaining unchanged in the previous quarter. For the whole of 2018, prices of landed properties rose by 6.3% while those of non-landed properties rose by 8.3%.
Prices of non-landed properties in Core Central Region (CCR) decreased by 1.0% in 4th Quarter 2018, compared with the 1.3% increase in the previous quarter. Prices of non-landed properties in Rest of Central Region (RCR) increased by 1.8%, compared with the 1.3% decrease in the previous quarter. Prices of non-landed properties in Outside Central Region (OCR) increased by 0.7%, compared with the 0.1% decrease in the previous quarter. For the whole of 2018, prices of non-landed properties in CCR, RCR and OCR increased by 6.7%, 7.4% and 9.4% respectively.
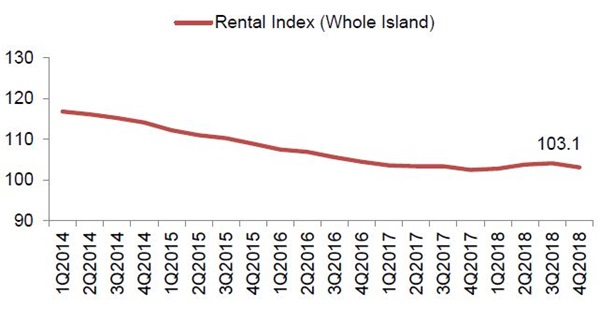
Rentals of private residential properties decreased by 1.0% in 4th Quarter 2018, compared with the 0.3% increase in the previous quarter.
For the whole of 2018, rentals of private residential properties increased by 0.6%, compared with the decline of 1.9% in 2017.
Rental Index of private residential properties
Rentals of landed properties decreased by 2.1% in 4th Quarter 2018, compared with the 0.5% increase in the previous quarter. Rentals of non-landed properties decreased by 0.8%, compared with the 0.3% increase in the previous quarter. For the whole of 2018, rentals of landed and non-landed properties increased by 2.0% and 0.4% respectively.
Rentals of non-landed properties in CCR decreased by 0.6%, compared with the 0.9% decrease in the previous quarter. Rentals in RCR decreased by 0.5%, compared with the 1.5% increase in the previous quarter. Rentals in OCR decreased by 1.7%, compared with the 0.9% increase in the previous quarter. For the whole of 2018, rentals of non-landed properties in CCR decreased by 0.1%, while rentals in RCR and OCR increased by 1.1% and 0.7% respectively.
Launches and Take-up
Developers launched 1,657 uncompleted private residential units (excluding ECs) for sale in 4th Quarter 2018, compared with 3,754 units in the previous quarter. For the whole of 2018, developers launched 8,769 uncompleted private residential properties, compared with 6,020 units in the previous year.
Developers sold 1,836 private residential units (excluding ECs) in 4th Quarter 2018, compared with the 3,012 units sold in the previous quarter. For the whole of 2018, developers sold 8,795 private residential units, compared with 10,566 units in the previous year.
Number of private housing units launched and sold by developers (excluding ECs)

Developers did not launch any EC units for sale in 4th Quarter 2018. Nevertheless, they sold 29 EC units from previous launches over the period. In comparison, developers did not launch any EC units and sold 84 EC units in the previous quarter. For the whole of 2018, developers launched 628 EC units and sold 1,136 EC units, compared with the 1,555 units launched and 4,011 units sold in 2017.
Resales and Sub-sales
There were 1,971 resale transactions in 4th Quarter 2018, compared with the 2,672 units transacted in the previous quarter. Resale transactions accounted for 51.1% of all sale transactions in 4th Quarter 2018, compared with 46.3% in the previous quarter. For the whole of 2018, there were 13,009 resale transactions, compared with the 14,043 resale transactions in 2017.
There were 53 sub-sale transactions in 4th Quarter 2018, compared with the 81 units transacted in the previous quarter. Sub-sales accounted for 1.4% of all sale transactions in 4th Quarter 2018, same as that in the previous quarter. For the whole of 2018, there were 335 sub-sale transactions, compared with the 401 sub-sale transactions in 2017.
Number of resale and sub-sale transactions for private residential units (excluding ECs)

Supply in the Pipeline
As at the end of 4th Quarter 2018, there was a total supply of 51,498 uncompleted private residential units (excluding ECs) in the pipeline with planning approvals3, compared with the 50,330 units in the previous quarter. Of this number, 34,824 units remained unsold as at the end of 4th Quarter 2018, up from 30,467 units in the previous quarter.
After adding the supply of 2,834 EC units in the pipeline, there were 54,332 units in the pipeline with planning approvals. Of the EC units in the pipeline, 825 units remained unsold. In total, 35,649 units with planning approvals (including ECs) remained unsold, up from 31,295 units in the previous quarter.
Total number of unsold private residential units in the pipeline

Based on the expected completion dates reported by developers, 10,312 units (including ECs) will be completed in 2019. Another 4,960 units (including ECs) will be completed in 2020.
Pipeline supply of private residential units and ECs (with planning approvals) by expected year of completion

Note: 9,112 private residential units and 4,130 executive condominiums were completed (i.e. obtained TOP) in 2018.
Apart from the 35,649 unsold units (including ECs) with planning approval as at the end of 4th Quarter 2018, there is a potential supply of 9,800 units (including ECs) from Government Land Sales (GLS) sites and awarded en-bloc sale sites that have not been granted planning approval yet. They comprise (a) about 6,500 units from awarded GLS sites and Confirmed List sites that have not been awarded yet, and (b) about 3,300 units from awarded en-bloc sale sites5.
Stock and Vacancy
The stock of completed private residential units (excluding ECs) increased by 3,165 units in 4th Quarter 2018, compared with an increase of 83 units in the previous quarter. The stock of occupied private residential units (excluding ECs) increased by 4,674 units in 4th Quarter 2018, compared with an increase of 1,042 units in the previous quarter. As a result, the vacancy rate of completed private residential units (excluding ECs) decreased to 6.4% at the end of 4th Quarter 2018, compared with 6.8% in the previous quarter.
Stock and vacancy of private residential units (excluding ECs)

Vacancy rates of completed private residential properties at the end of 4th Quarter 2018 in CCR, RCR and OCR were 7.9%, 7.4% and 5.1% respectively, compared with the 10.4%, 8.1% and 4.5% in the previous quarter.
OFFICE SPACE
Office market at a glance:

Prices and Rentals
Prices of office space increased by 2.4% in 4th Quarter 2018, compared with the 0.1% increase in the previous quarter. Rentals of office space increased by 0.5% in 4th Quarter 2018, compared with the 2.5% increase in the previous quarter. For the whole of 2018, prices of office space increased by 5.7%, compared with the decline of 2.4% in 2017; while rentals of office space increased by 7.4%, compared with the increase of 0.4% in 2017.
Property Price Index of office space in Central region

Rental Index of office space in Central region

Supply in the Pipeline
As at the end of 4th Quarter 2018, there was a total supply of about 732,000 sq m GFA of office space in the pipeline, compared with the 793,000 sq m GFA of office space in the pipeline in the previous quarter.
Pipeline supply of office space

Note: 197,132 sq m of office space was completed (i.e. granted TOP) in 2018
Stock and Vacancy
The amount of occupied office space increased by 39,000 sq m (nett) in 4th Quarter 2018, compared with the increase of 45,000 sq m (nett) in the previous quarter. The stock of office space increased by 59,000 sq m (nett) in 4th Quarter 2018, compared with the increase of 28,000 sq m (nett) in the previous quarter. As a result, the island-wide vacancy rate of office space rose to 12.1% at the end of 4th Quarter 2018, from 12.0% at the end of the previous quarter.
Stock and vacancy of office space

RETAIL SPACE
Retail market at a glance:

Prices and Rentals
Prices of retail space increased by 1.5% in 4th Quarter 2018, compared with the increase of 0.3% in the previous quarter. Rentals of retail space increased by 1.2% in 4th Quarter 2018, compared with the decrease of 1.2% in the previous quarter. For the whole of 2018, prices of retail space increased by 0.6%, compared with the decline of 8.8% in 2017; while rentals of retail space decreased by 1.0%, compared with the decline of 4.7% in 2017.
Property Price Index of retail space in Central region

Rental Index of retail space in Central region

Supply in the Pipeline
As at the end of 4th Quarter 2018, there was a total supply of 387,000 sq m GFA of retail space from projects in the pipeline, compared with the 501,000 sq m GFA of retail space in the pipeline in the previous quarter.
Pipeline supply of retail space

Note: 209,078 sq m of retail space was completed (i.e. granted TOP) in 2018.
Stock and Vacancy
The amount of occupied retail space increased by 24,000 sq m (nett) in 4th Quarter 2018, compared with a decrease of 26,000 sq m (nett) in the previous quarter. The stock of retail space increased by 84,000 sq m (nett) in 4th Quarter 2018, compared with the decrease of 11,000 sq m (nett) in the previous quarter. As a result, the island-wide vacancy rate of retail space increased to 8.5% at the end of 4th Quarter 2018, from 7.6% at the end of the previous quarter.
Stock and vacancy of retail space

How to Secure a Home Loan Quickly
If you are looking for a property like the Binjai Park Good Class Bungalow but are ensure of funds availability for purchase, our mortgage consultants at iCompareLoan can set you up on a path that can get you a home loan in a quick and seamless manner.
Our consultants have close links with the best lenders in town and can help you compare Singapore home loans and settle for a package that best suits your home purchase needs. Find out money saving tips here.
Whether you are looking for a new home loan or to refinance your existing one, the Mortgage broker can help you get everything right from calculating mortgage repayment, comparing interest rates all through to securing the best home loans in Singapore. And the good thing is that all our services are free of charge. So it’s all worth it to secure a loan through us.
For advice on a new home loan.
For refinancing advice.