Q2 2020 RETAIL SPACE
Retail market at a glance:
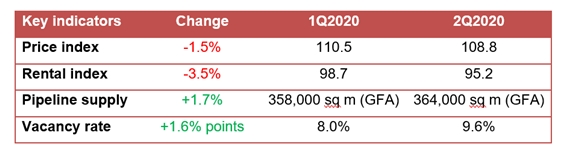
Q2 2020 retail space Prices and Rentals
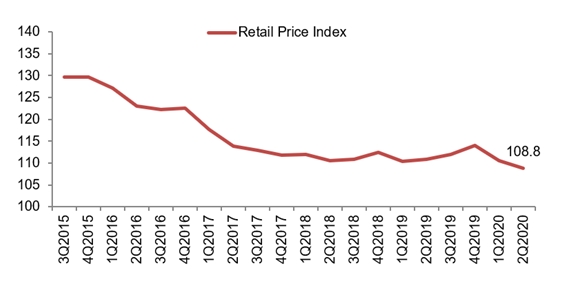
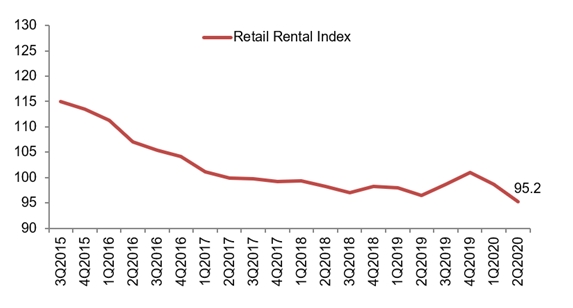
Prices of retail space decreased by 1.5% in 2nd Quarter 2020, compared with the decrease of 3.1% in the previous quarter. Rentals of retail space decreased by 3.5% in 2nd Quarter 2020, following the decrease of 2.3% in the previous quarter.
Q2 2020 retail space Property Price Index of retail space in Central Region
Q2 2020 retail space Rental Index of retail space in Central Region
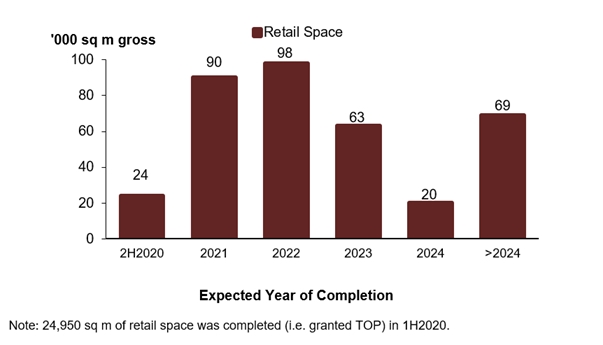
Supply in the Pipeline according to Q2 2020 retail space statistics
As at the end of 2nd Quarter 2020, there was a total supply of 364,000 sq m GFA of retail space from projects in the pipeline, compared with the 358,000 sq m GFA of retail space in the pipeline in the previous quarter.
Pipeline supply of retail space
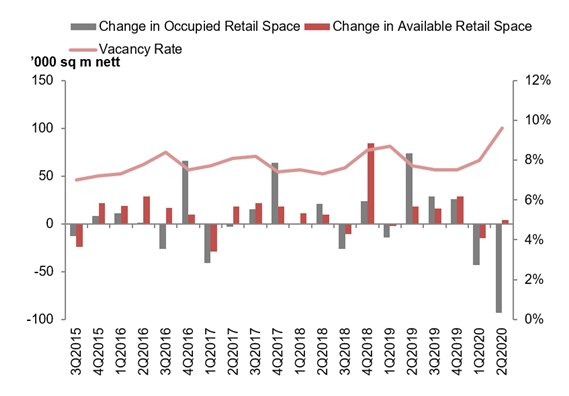
Stock and Vacancy
The amount of occupied retail space decreased by 93,000 sq m (nett) in 2nd Quarter 2020, compared with the decrease of 43,000 sq m (nett) in the previous quarter. The stock of retail space increased by 4,000 sq m (nett) in 2nd Quarter 2020, compared with the decrease of 15,000 sq m (nett) in the previous quarter. As a result, the island-wide vacancy rate of retail space increased to 9.6% as at the end of 2nd Quarter 2020, from 8.0% as at the end of the previous quarter.
Stock and vacancy of retail space
Commenting on URA‘s Q2 2020 retail space, CBRE said:
- “With the effect of the COVID-19 “circuit breaker” in full force, leasing activity slowed and rental corrections for Q2 2020 became more severe. Retail rents in the Central Region fell by 3.5% q-o-q, representing the second consecutive quarter of decline.
- The largest rental decline was seen in the Central Area, where the rental index declined by 4.9% q-o-q in Q2 2020. This can be attributed to higher degrees of stress in the Downtown Core, Marina Area and Orchard Area, as footfall in these areas have been negatively impacted by travel restrictions and work-from-home measures.
- Tenant retention has been challenging, and the number of closures in Q2 2020 has escalated in the F&B and entertainment sectors. There were also consolidations for tenants experiencing cashflow difficulties while they place a higher priority on their better performing locations. Against this challenging retail backdrop, net absorption for Q2 2020 declined by 93,000 sq m, following -43,000 sq m in the previous quarter. As a result, island-wide vacancy rate inched up to 9.6% in Q2 2020 from 8.0% in Q1 2020.
- Vacancy levels are expected to increase in H2 2020, given that more retailers are considering downsizing their store footprint to cut cost. Companies are also refocusing their efforts to build their online presence, in line with managing their physical stores.
- To date, the rental index for the Central Region has declined by 5.8% in H1 2020. Rental correction is expected to accelerate in H2 2020, as landlords face increasing pressure to strike a balance between occupancy and rents. In addition, with rental rebates via government reliefs rolled back by then, landlords and tenants will be left bearing the full brunt of the impact.”
Q2 2020 office space Prices and Rentals
Prices of office space decreased by 4.3% in 2nd Quarter 2020, compared with the 4.0% decrease in the previous quarter. Rentals of office space remained unchanged in 2nd Quarter 2020, compared with the 0.8% decrease in the previous quarter. As at the end of 2nd Quarter 2020, there was a total supply of about 668,000 sq m GFA of office space in the pipeline, compared with the 682,000 sq m GFA of office space in the pipeline in the previous quarter.
The amount of occupied office space decreased by 55,000 sq m (nett) in 2nd Quarter 2020, compared with the decrease of 7,000 sq m (nett) in the previous quarter. The stock of office space increased by 43,000 sq m (nett) in 2nd Quarter 2020, compared with the increase of 33,000 sq m (nett) in the previous quarter. As a result, the island-wide vacancy rate of office space increased to 12.1% as at the end of 2nd Quarter 2020, from 11.0% as at the end of the previous quarter.
Q2 2020 Residential Properties
The 2nd Quarter 2020 real estate statistics showed that prices of private residential properties increased by 0.3% in 2nd Quarter 2020, compared with the 1.0% decrease in the previous quarter.
Prices of landed properties remained unchanged in 2nd Quarter 2020 real estate statistics, compared with the 0.9% decrease in the previous quarter. Prices of non-landed properties increased by 0.4% in 2nd Quarter 2020, compared with the 1.0% decrease in the previous quarter.
Prices of non-landed properties in Core Central Region (CCR) increased by 2.7% in 2nd Quarter 2020, compared with the 2.2% decrease in the previous quarter. Prices of non-landed properties in Rest of Central Region (RCR) decreased by 1.7%, compared with the 0.5% decrease in the previous quarter. Prices of non-landed properties in Outside Central Region (OCR) increased by 0.1%, compared with the 0.4% decrease in the previous quarter.
Rentals of private residential properties decreased by 1.2% in 2nd Quarter 2020 real estate statistics, compared with the 1.1% increase in the previous quarter.
CBRE said, “the trend was driven by the resilient nature of landed segment and non-landed properties in the OCR where prices remained relatively unchanged in Q2 2020.”
CBRE added, “launch activities took a backseat with disruptions from the COVID-19 pandemic as show flats were mandated to close during the “circuit breaker” period. Developers launched 1,852 units in Q2 2020, compared with 2,093 units in the previous quarter.”
“Despite that, new home sales managed to clock in at 1,713 units (excluding ECs), a sign that buyers are still actively looking for opportunities in the market. Sales may be driven by some developers offering discounts and incentives. The low interest rate environment has also motivated buyers.”