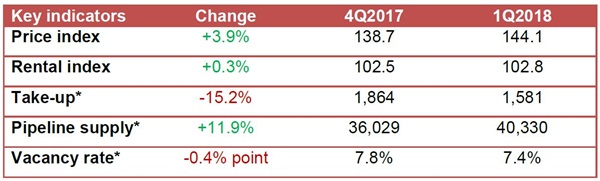
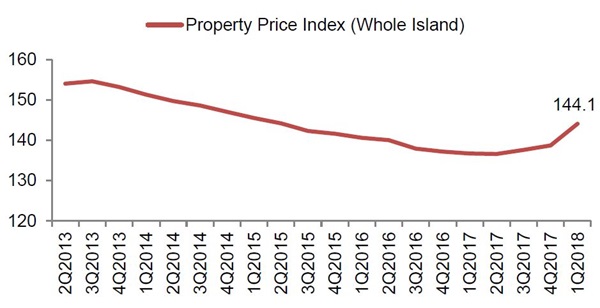
The Urban Redevelopment Authority today announced that the prices of private residential units increased by 3.9 per cent in 1st Quarter of 2018, compared with the 0.8 per cent increase in the previous quarter.
Property Price Index of private residential properties
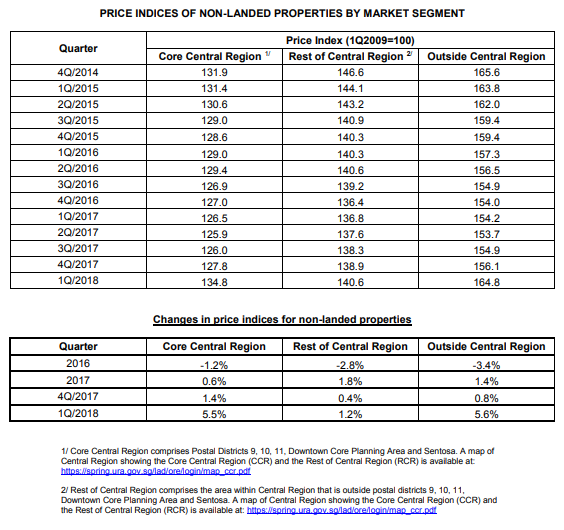
Prices of landed properties rose by 1.9% in 1st Quarter 2018, compared with the 0.5% increase in the previous quarter. Prices of non-landed properties rose by 4.4%, compared with the 0.8% increase in the previous quarter.
Prices of non-landed properties in Core Central Region (CCR) increased by 5.5% in 1st Quarter 2018, compared with the 1.4% increase in the previous quarter. Prices of non-landed properties in Rest of Central Region (RCR) increased by 1.2%, compared with the 0.4% increase in the previous quarter. Prices of non-landed properties in Outside Central Region (OCR) increased by 5.6%, compared with the 0.8% increase in the previous quarter.

Rental Index of private residential properties
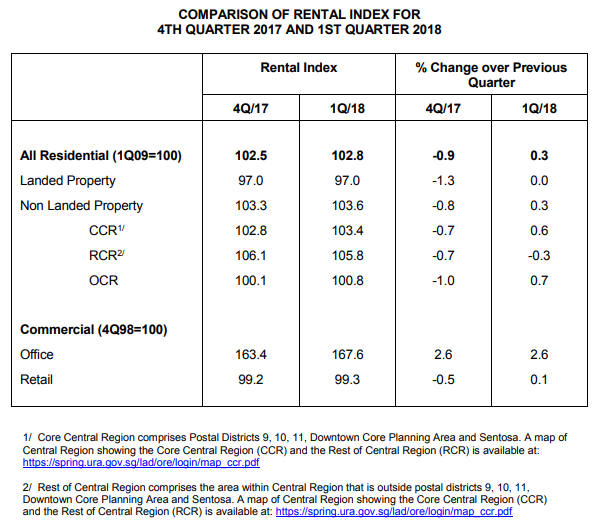
Rentals of private residential properties increased by 0.3% in 1st Quarter 2018, compared with the 0.9% decline in the previous quarter.

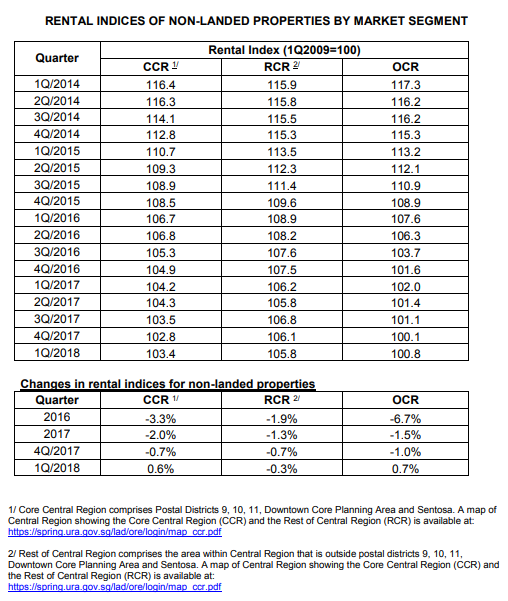
Rentals of landed properties remained unchanged in 1st Quarter 2018, compared with the 1.3% decrease in the previous quarter. Rentals of non-landed properties increased by 0.3%, compared with the 0.8% decrease in the previous quarter.
Rentals of non-landed properties in CCR increased by 0.6%, compared with the 0.7% decrease in the previous quarter. Rentals in RCR decreased by 0.3%, compared with the 0.7% decrease in the previous quarter. Rentals in OCR increased by 0.7%, compared with the 1.0% decrease in the previous quarter.
Launches and Take-up
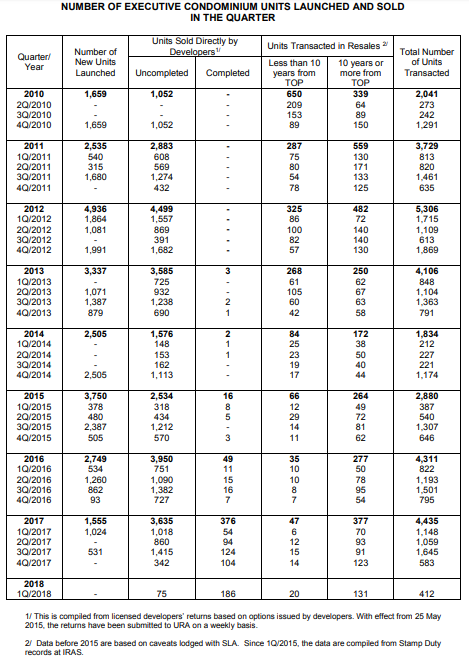
Developers launched 921 uncompleted private residential units (excluding ECs) for sale in 1st Quarter 2018, compared with 877 units in the previous quarter.

Developers sold 1,581 private residential units (excluding ECs) in 1st Quarter 2018, compared with the 1,864 units sold in the previous quarter.

Number of private housing units launched and sold by developers (excluding ECs)

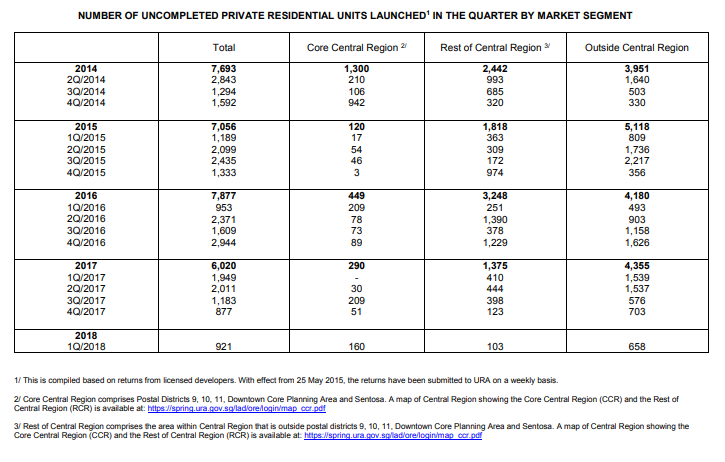

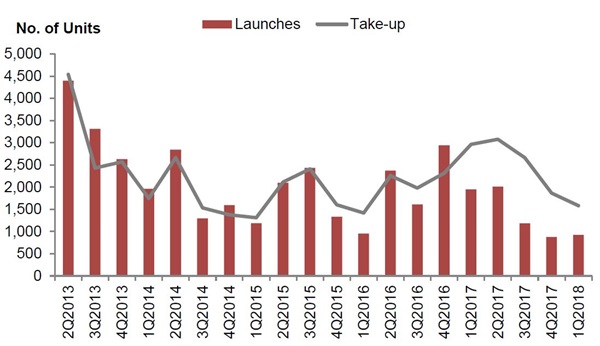
Table of Contents
Developers did not launch any EC projects for sale in 1st Quarter 2018. Nevertheless, they sold 261 EC units from previous launches over the period. In comparison, developers did not launch any EC units and sold 446 EC units in the previous quarter.
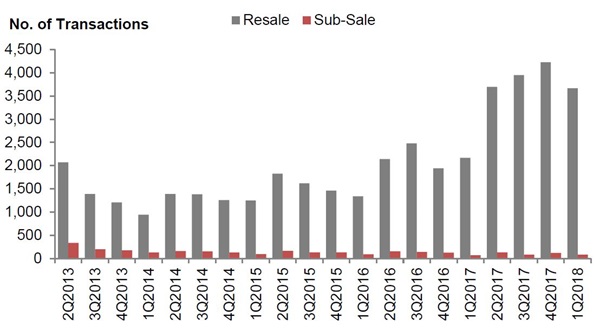
Resales and Sub-sales
There were 3,666 resale transactions in 1st Quarter 2018, compared with the 4,226 units transacted in the previous quarter. Resale transactions accounted for 68.8% of all sale transactions in 1st Quarter 2018, compared with 68.1% in the previous quarter.
There were 81 sub-sale transactions in 1st Quarter 2018, compared with the 120 units transacted in the previous quarter. Sub-sales accounted for 1.5% of all sale transactions in 1st Quarter 2018, compared with 1.9% in the previous quarter.
Supply in the Pipeline
As at the end of 1st Quarter 2018, there was a total supply of 40,330 uncompleted private residential units (excluding ECs) in the pipeline with planning approvals, compared with the 36,029 units in the previous quarter. Of this number, 23,514 units remained unsold as at the end of 1st Quarter 2018, up from 18,891 units in the previous quarter.
After adding the supply of 3,931 EC units in the pipeline, there were 44,261 units in the pipeline with planning approvals. Of the EC units in the pipeline, 679 units remained unsold. In total, 24,193 units with planning approvals (including ECs) remained unsold, up from 19,755 units in the previous quarter.
https://www.icompareloan.com/resources/property-market-sentiments-upbeat/
Total number of unsold private residential units in the pipeline

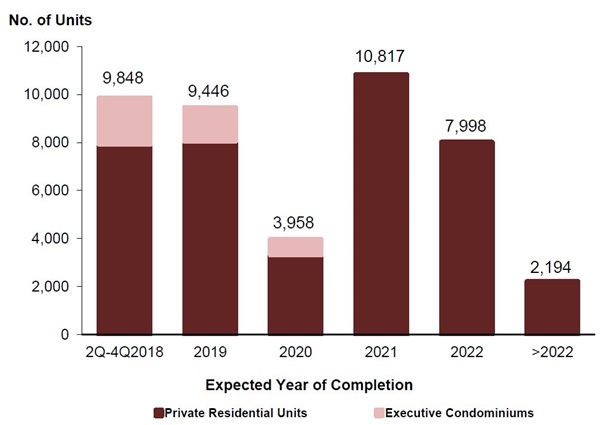
Based on the expected completion dates reported by developers, 9,848 units (including ECs) will be completed in the next 3 quarters of 2018. Another 9,446 units (including ECs) will be completed in 2019.
Pipeline supply of private residential units and ECs by expected year of completion
The redevelopment of the large number of private residential developments sold en-bloc since 2016 will add a significant number of new housing units to the supply pipeline.
As at the end of 1st Quarter 2018, there were 24,193 unsold units with planning approval5, up from 19,755 units as at the end of 4th Quarter 2017. In addition, there is a potential supply of 20,100 units (including ECs) from Government Land Sales (GLS) sites and awarded en-bloc sale sites that have not been granted planning approval yet. They comprise (a) about 6,900 units from awarded GLS sites and Confirmed List sites that have not been awarded yet, and (b) about 13,200 units from awarded en-bloc sale sites6. A large part of this new supply of 20,100 units could be made available for sale later this year or next year, and will be completed from 2021 onwards.
Stock and Vacancy
The stock of completed private residential units (excluding ECs) increased by 1,296 units in 1st Quarter 2018, compared with an increase of 4,205 units in the previous quarter. The stock of occupied private residential units (excluding ECs) increased by 2,950 units in 1st Quarter 2018, compared with an increase of 5,781 units in the previous quarter. As a result, the vacancy rate of completed private residential units (excluding ECs) decreased to 7.4% at the end of 1st Quarter 2018, compared with 7.8% in the previous quarter (see Annex E-1).
Stock and vacancy of private residential units (excluding ECs)
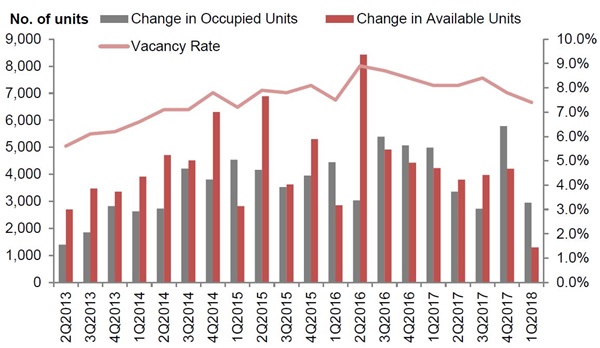
Vacancy rates of completed private residential properties at the end of 1st Quarter 2018 in CCR, RCR and OCR were 11.6%, 8.3% and 4.9% respectively, compared with the 11.2%, 8.5% and 5.9% in the previous quarter.
OFFICE SPACE
Office market at a glance

Prices and Rentals
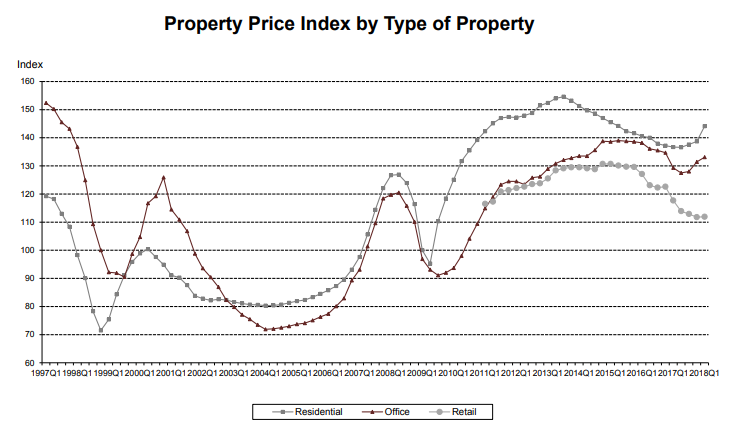
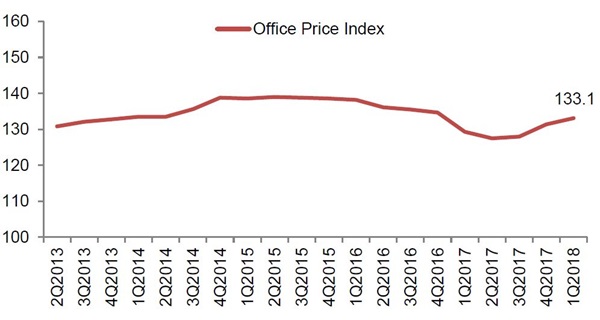
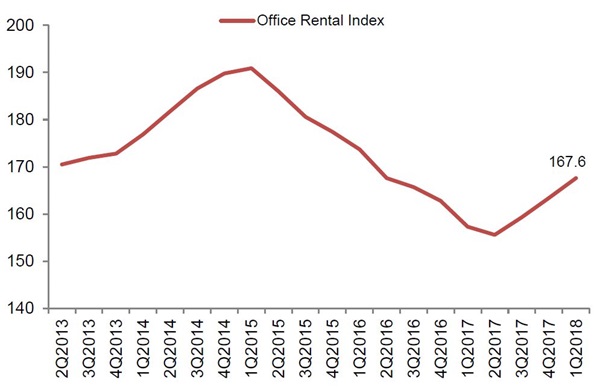
Prices of office space increased by 1.3% in 1st Quarter 2018, compared with the 2.7% increase in the previous quarter. Rentals of office space rose at the same pace as the previous quarter, by 2.6% in 1st Quarter 2018.
Property Price Index of office space in Central region
Rental Index of office space in Central region
Supply in the Pipeline
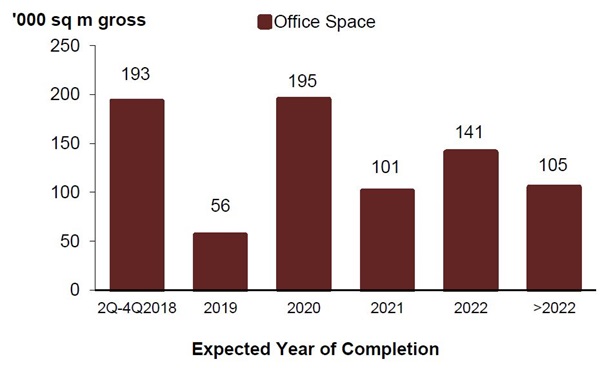
As at the end of 1st Quarter 2018, there was a total supply of about 791,000 sq m GFA of office space in the pipeline, compared with the 597,000 sq m GFA of office space in the pipeline in the previous quarter.
Pipeline supply of office space
Stock and Vacancy
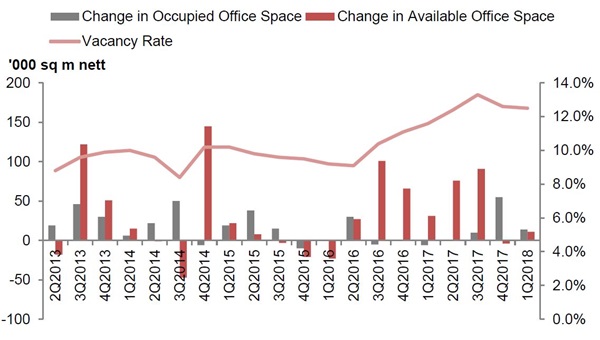
The amount of occupied office space increased by 14,000 sq m (nett) in 1st Quarter 2018, compared with the increase of 55,000 sq m (nett) in the previous quarter. The stock of office space increased by 11,000 sq m (nett) in 1st Quarter 2018, compared with the decrease of 4,000 sq m (nett) in the previous quarter. As a result, the island-wide vacancy rate of office space at the end of 1st Quarter 2018 dropped to 12.5%, from 12.6% at the end of the previous quarter.
Stock and vacancy of office space
RETAIL SPACE
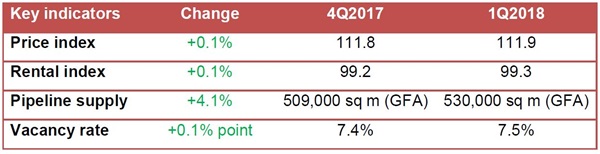
Retail market at a glance
Prices and Rentals
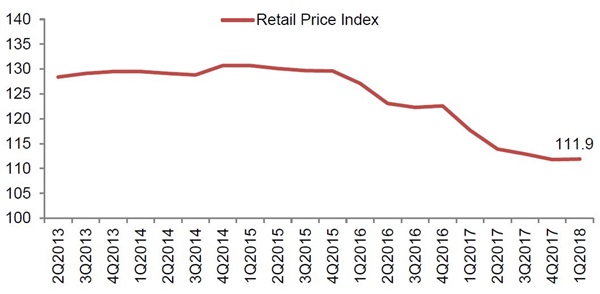
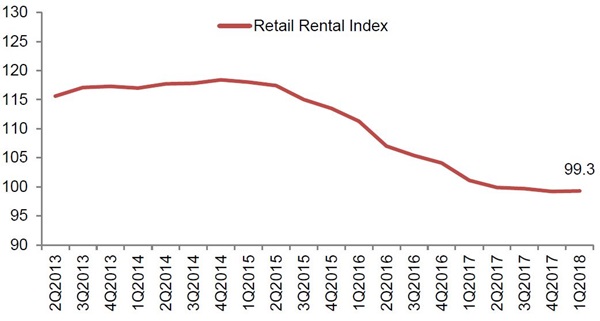
Prices of retail space increased by 0.1% in 1st Quarter 2018, compared with the decrease of 1.0% in the previous quarter. Rentals of retail space increased by 0.1% in 1st Quarter 2018, compared with the decrease of 0.5% in the previous quarter.
Property Price Index of retail space in Central region
Rental Index of retail space in Central region
Supply in the Pipeline
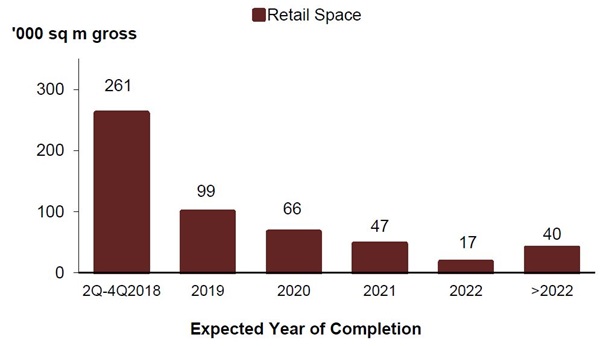
As at the end of 1st Quarter 2018, there was a total supply of 530,000 sq m GFA of retail space from projects in the pipeline, compared with the 509,000 sq m GFA of retail space in the pipeline in the previous quarter.
Pipeline supply of retail space
Stock and Vacancy
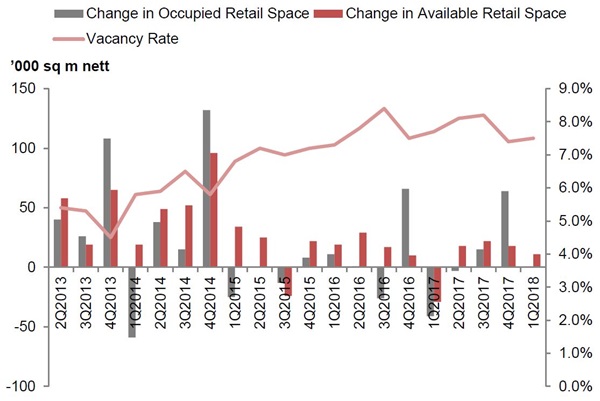
The amount of occupied retail space remained unchanged in 1st Quarter 2018, compared with the increase of 64,000 sq m (nett) in the previous quarter. The stock of retail space increased by 11,000 sq m (nett) in 1st Quarter 2018, compared with the increase of 18,000 sq m (nett) in the previous quarter. As a result, the island-wide vacancy rate of retail space increased to 7.5% at the end of 1st Quarter 2018, from 7.4% at the end of the previous quarter.
https://www.icompareloan.com/resources/private-residential-property-highest-8-years/
Stock and vacancy of retail space
—
If you are house-hunting it is advisable to get a mortgage broker to help in your home loan as well as a buyer property agent to assist you in your purchase.